Difference between revisions of "Data"
Jump to navigation
Jump to search
(Start page!) |
(add images!) |
||
| Line 8: | Line 8: | ||
* Time of day/month/year | * Time of day/month/year | ||
* Add your ideas! | * Add your ideas! | ||
| + | |||
| + | ==Graphs== | ||
| + | |||
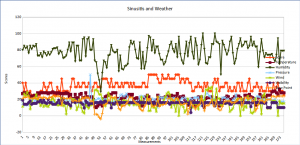
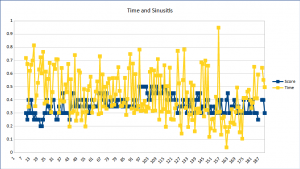
| + | We can make graphs of sinusitis [[symptoms]] including time series. | ||
| + | |||
| + | [[File:Sinusitis and Weather.png|thumb|We can make graphs of sinusitis [[symptoms]] including time series.]] | ||
| + | |||
| + | [[File:Time and Sinusitis.png|thumb|We can make graphs of sinusitis [[symptoms]] including time series.]] | ||
Revision as of 06:51, 18 July 2021
Sinus data can assist people in identifying causes, correlations, or patterns in their sinus symptoms. Some ideas of data to analyze include:
- Sinus symptoms
- Weather
- Allergens
- Diet
- Exercise
- Time of day/month/year
- Add your ideas!
Graphs
We can make graphs of sinusitis symptoms including time series.

We can make graphs of sinusitis symptoms including time series.

We can make graphs of sinusitis symptoms including time series.